Friday, February 26, 2010

Misleading statements In BC Pavillion

Signs at the BC Pavilion claim that "British Columbia is taking action onclimate change" and "Our carbon footprint is getting smaller"

Unfortunately these statements are not true.

BC is the only province that saw emissions from industrial sources INCREASE in 2008. Even Alberta managed to at least keep its emissions steady.

The province's own reports admit that emissions will also increase from highway construction projects that are currently under-way. There are plans for over 1,000 km of new highway lanes including the controversial Gateway Program. While the province has reduced funding for almost all other services including public transit, it has kept the funding for new highway projects.

Transportation is the largest source of ghg emissions in the Province.

The province has also not reduced the subsidies for oil and gas companies. Fossil fuel production is the second largest source for ghg emissions in the province.

The sign makes reference to electrical generation which only accounts for 2% of the province's ghg emissions. So changes in this sector will do little to reduce our carbon footprint.

Given this factors it is almost impossible for the province to meet the one third reduction mentioned in the poster.


Thursday, February 25, 2010

The Cauldron as Symbol

At the Olympics opening ceremonies a huge cauldron on Vancouver's waterfront was unveiled and lit.  Shortly after that it was revealed that the cauldron would be kept in place after the games.  What is not so clear is if the cauldron will remain lit indefinitely or only for special occasions.

The media has focused on the controversial fence surrounding the flame.  But many people have come forth to question the cauldron itself.

Prior to the games there was much speculation that this cauldron might be a radical departure from previous games in keeping with the "greenest games" theme that VANOC was trying to promote.  Some people promoted the idea of a "cauldron" that used efficient LED lighting powered by BC's relatively clean power sources.

Instead VANOC chose a cauldron that consisted of not one but four huge natural gas flames.  Compared to the huge greenhouse gas footprint that the games will leave, the emissions from these flames are relatively minor.

But, more important is the symbolism associated with the cauldron.  If VANOC was really taking sustainability seriously why didn't they choose a design that produced fewer emissions than previous cauldrons?  Even if they had to keep a small flame there could have been a spectacular design that combined a smaller flame with some LED lighting.

And one has to question the symbolism of the city of Vancouver keeping the flame around even if it is only lit occasionally.

photo by GillTy.
http://www.flickr.com/photos/47071485@N02/ / CC BY-NC 2.0

Wednesday, February 24, 2010

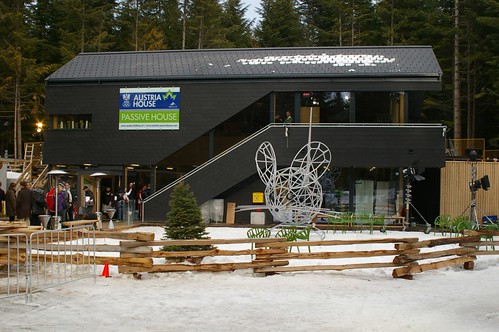
The First Passivhaus in Canada

The LEED buildings being used for the winter Olympics are often described as "leading edge."  LEED certification does mean that a building has a significantly better energy performance than the average North American building.  But if one takes a global perspective this certification can hardly be described as "leading edge."

That label might be more accurately applied to the Passivhaus standard that has been developed in Europe.  There are over 20,000 of these buildings now in Europe and about 10 in the US. Canada's first PassivHaus recently opened in Whistler.  It is currently being used by the Austrian Olympic team but will be turned over the Municipality of Whistler after the games.  It is interesting that despite the rhetoric about sustainability from VANOC and the Province this project was initiated by other parties.  In my mind it is one of the few truly sustainable elements associated with the 2010 Olympics.

I had an opportunity to tour it recently.  Note that the information below is based on my hastily scribbled notes and I welcome corrections and additions.

Part of the core design of a Pasivhaus are walls, floors and ceilings that are supper insulated.  There is also an attempt made to eliminate all thermal bridges.  The Whistler Passivhaus walls and roof were built using prefabricated 10 cm thick solid wood panels that were also structural.  On the outside of the wood panels was 36 cm of insulation for the roof and 30 cm for the walls. On the outside of the insulation was a breathable barrier, a venting space and then the cladding.

Since 40-60% of heat loss occurs through windows these are also important elements in the design.  The windows used have U-value of 0.85 W/(m².K) or an imperial r-value of 7-7.5.  Wood fiber insulation is used in the window frame.  The windows provide twice the insulation value of a typical 3 pane window.  Most of the glazing is on the south side, with some of the east and west and none facing north.  The windows do have overhangs designed to provide some thermal shading in the summer.

The building is also very airtight.  It scored 0.28 on a blower door test.  Because it is so air tight the building uses a heat recovery ventilation (HRV) system.

Heating is provided by a ground source heat pump.  The geo-exchange field is is only 100 m² and located on the south side of the building (for solar recharging).  It contains 200 m of pipe in a buried in a horizontal loop 2 m deep.  The heat pump itself is small - only 3 kW but has COP of 4.5.  There is no backup or auxiliary heating for the heat pump.

Heat from the heat pump is delivered through in floor hydronics located in some sections of the floor.  If need it can also be sent through the HRV.  This heat pump also is used for domestic hot water.

Because the system is optimized for lower occupancy they are actually having to deal with over-heating during the winter games.

The 300 m² building is expected to use a total 35 kWh/m² of energy.  Approximately 17 kWh/m² for heating and the rest for other electrical use.  The costs were about $370 / m² but it is expected that future projects in the area will be around $300/m².

This infromation was compiled with the help of Vancouver Renewable Energy and Salal Permaculture.


Is the Athlete's Village the Greenest Neighbourhood in the Word?

The Olympic Athlete's village in Vancouver, also known as South East False Creek (SEFC), recently received LEED Platinum certification.  Politicians and the media were quick to call it the "greenest neighbourhood in the world."   But they offerred little evidence to support this cliam.

It is an important development that is certainly one of the greenest in the north America.  But in the world?  What about other neighbourhoods in the world?

Take for example Vauban, Freiburg, Germany.

Vauban is completely car-free. SEFC is not.  In fact, the development will increase motor traffic on a section of the Ontario bike route.

Vauban has 100 units that meet Passivhaus standards. SEFC has zero (Passihaus is a much higer standard than LEED).

All units in Vauban meet the low energy standard of 65 kWh/m2. I am not sure about SEFC but it is probably not that low.

Vauban has municipal composting of food waste. SEFC - not yet.

Vauban has an organic food coop. SEFC - you might find some in Urban Fare.

Vauban has a working urban farm. SE FC has planned for a "demonstration" community garden.

Vauban has an efficeint district heating system using bio-fuels. SE FC also has a highly efficient district heating system but still uses some natural gas (proably a higher ghg footprint).

Vanuban has onsite electrical generation (co-gen plants and photovoltaics). SE FC has none.


Tuesday, February 23, 2010

Not Quite Zero Waste

The Olympic Games organizers have set a goal of zero waste for the games.  Apparently they are achieving this through incineration - burning some of the waste generated.

You would think that they would also make an effort to eliminate disposable products as much as possible.  Apparently not.  An article about the German team reports that athletes are eating off paper plates and using plastic cutlery in the Whistler Athlete's village.

Thursday, February 18, 2010

The Greenwash Games are Underway

A few years ago the 2010 Winter Olympics Games were promoted as the “greenest” games. But as they approached it beame evident that environmental sustainability was not a real priority and that a more appropriate label might be “greenwash games.” The Olympics helped start a massive highway expansion program, tens of thousands of trees were cut down, two separate red-listed (endangered) habitats were paved over, sponsorship deals signed with the worst greenhouse gas emitters, VANOC revealed a fleet of SUVs and they failed to meet their own ghg offset targets.


As the games began critics of these policies made their voices heard. When the Olympic torch arrived in Vancouver opponents took to the streets in large enough numbers that the torch had to be re-routed twice. And as the opening ceremonies began thousands marched through the streets for several blocks until they were finally stopped just across the street from the site of the ceremonies. People were in the streets for a variety of reasons including the social and financial costs of the games. But one of the prominent themes on protester's signs was the ecological costs.


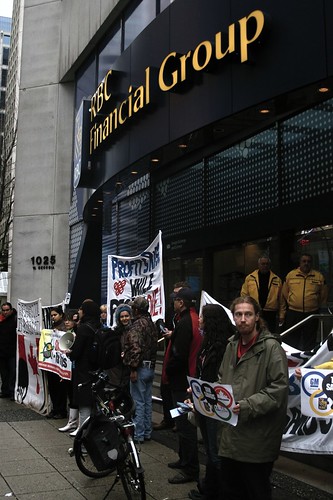
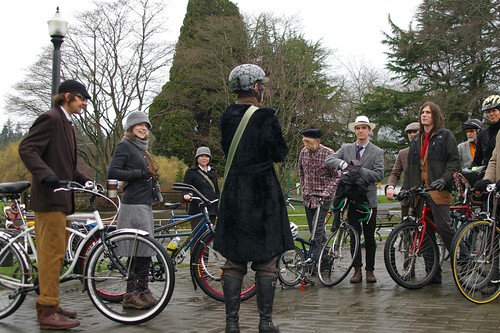
Protests continued the following day. The media focused on the destruction that occured at the more militant protest but that action was not the only one in the region. Community leaders from first nations affected by the Tar Sands spoke to a crowd outside the RBC's main Vancouver branch. RBC is one of largest funders of the Tar Sands. In the suburbs another First Nations group temporarily blocked a bridge to protest the ecological damage done by that project. On a quieter note cyclists participated in Vancouver's first “tweed ride.” And campaigners dressed as polar bears prepared to be deployed.


The first few days of the games have brought above normal temperatures. But organizers and sponsors still seem to be a long way from taking responsibility for climate change.


Thursday, February 11, 2010

Is VANOC really creating fewer greenhouse gas emissions?

With the Olympics only one day away there is plenty of talk about the games and the warm weather.  And commentators are weighing in on how far the games have gone to support environmental initiatives.

David Suzuki and Faisal Moola have written a commentary on this issue.  They correctly point out that sustainable transportation will not be a legacy of these games.  But they do offer VANOC some praise when they suggest that these Olympics are expected to produce few greenhouse gas (ghg) emissions than previous Winter Olympics.

I decided to take a close look at the numbers used to make this claim.  The scorecard produced by the David Suzuki Foundation (DSF) estimates that the overall emissions will be reduced by around 15%.  Where will this reduction come from?

DSF estimated that emissions from electricity at venues will be 12,000 tonnes.  VANOC and BC Hydro have claimed that this represents a 90% reduction in emissions.  Which means the reduction from electricity alone would be about 108,000 tonnes.

But 108,000 tonnes is over 30% of estimated total emissions for the games (328,000).  That means that the 15% reduction doesn't even cover the reduction from electricity.  Or in other words, if you remove venue electricity from the equation there would actually be a net INCREASE in ghg emission compared to previous games.

The reason why there is such a large reduction for electricity is that over 85% of electricity consumed in BC comes from hydro power.  And this means that other locations that have hosted the games have a much higher ghg component to their electricity.

VANOC can not really take credit for this clean electricity being available.  The hydro projects were built decades ago.  If these calculation are right, it means that in the sectors that VANOC was responsible for they actually managed to increase ghg emissions.


Tuesday, February 9, 2010

VANOC reveals its approach to sustainable tranporation

I think this photo pretty well sums up VANOC's approach to the sustainable transportation at the 2010 Olympic Games in Vancouver. 

One of the over 4,000 official SUVs parked in a bike lane. 

Sunday, February 7, 2010

How many SUVs does it take to run an olympics?


GM has supplied over 4,000 vehicles for VANOC to use for the 2010 Winter Olympics.  They can be seen parked in several large lots in Vancouver and Whistler.  Almost all of the vehicles are SUVs.  Yes, a few are hybrids and there is one fuel cell vehicle, but most are just regular gas guzzling SUVs.

In the weeks leading up to the games the large white SUVs could often be spotted around town.  They almost without exception would contain just a single occupant.  A Squamish resident related seeing four stopped at a light all going the same direction and all with single occupant.

If VANOC was truly interested in sustainability couldn't they have found better transportation solutions? Why not public transit or even bikes for all those single occupancy trips?  Or at the very least they should have found something more fuel efficient than an SUV.

Bikes Invade Richmond

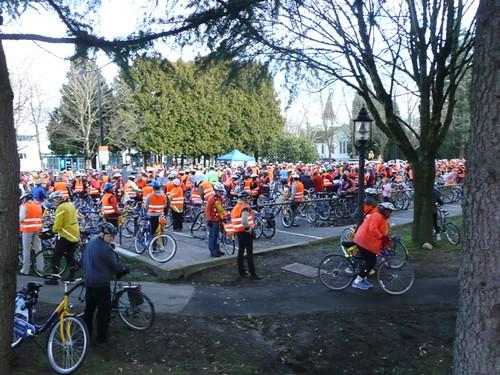
On Saturday morning hundreds of cyclists road Critical Mass style through the street of Richmond, BC.  It was a "Go Green Go Dutch Go Bike" event that was also the kick-off for a program that saw the Netherlands Consulate donate 400 bikes for use during the Olympic period. The Third Wave Cycling blog has a good description of the ride.

The program to donate 400 bikes for use at the Richmond venues seems to me to be one of the few truly "green" elements to the 2010 games.  Not surprisingly it is not VANOC initiative.

Friday, February 5, 2010

Two Lists

29 examples of negative environmental mistakes and impacts of the 2010 games:

  1. major highway expansion instead of using rail connections to Whistler
  2. rare ecosystems lost from Sea to Sky highway upgrade
  3. endangered species habitat destroyed in Sea to Sky highway upgrade
  4. encroachment on Grizzly habitat in Callaghan Valley
  5. over 80,000 trees cut down in Callaghan Valley
  6. huge sewage treatment plant built in Callaghan Valley (previously wilderness) to facilitate future development instead of a more sustainable composting system
  7. ski trail cut without proper buffers next to riparian habitat in Callaghan Valley
  8. paving over the red-listed (endangered) wet land in Whistler for bus parking (even though the huge parking lots regularly used by the public will be available for the Olympics)
  9. over 800 old-growth trees were cut in the heart of Whistler village for an unnecessary celebration plaza.
  10. construction that degraded creek at Downhill Course (work went beyond what Biologists indicated was “safe”) despite the fact the existing course has been used for FIS World Cup downhills for years
  11. use of over 4,000 SUV vehicles (often with a single occupant) for Olympic business instead of more fuel efficient transportation options
  12. use of Hydrogen buses with fuel shipped in from Quebec instead of using more electrically efficient options like trolley buses or electric trains
  13. closing cycling routes in Vancouver and failing to implement safe, efficient detours despite promises to do so
  14. poor management of LEED buildings used for venues (unnecessary lights left on 24 hours a day)
  15. hundreds of generators generating excess C02 and dangerous particulate matter (the generators are being used beyond VANOC claims they are needed for and beyond what BC Hydro says they are needed for)
  16. back-tracking on promises to implement renewable energy at venues
  17. refusing offer to use trains for Olympics and using SUVs / buses instead
  18. blacking out energy efficient daylight features at Richmond Oval
  19. using bio-accumulative chemicals at Cypress bowl venue
  20. claiming that the Games are carbon neutral but only offsetting 1/3 of the emissions
  21. failing to account for all the ghg emissions from the games
  22. failing to meet 90% ghg reduction target for energy use at venues
  23. large pollution impact from trucking (and flying?) snow to Cypress Bowl venue
  24. allowing RBC the largest commercial bank financier of the Tar Sands to be a major Olympic sponsor.
  25. allowing PetroCanada the retail arm of the first and one of the largest Tar Sands extractors to be a major Olympic sponsor
  26. allowing TransCanada pipelines which brings products from the Tar Sands to be an Olympic supplier.
  27. allowing General Motors, one of the leading corporate opponents of effective action on climate change to be an Olympic sponsor (Only two years ago, a vice-chairman of GM called global warming a "total crock of shit.")
  28. ammonia leaks from Whistler sliding centre
  29. Sliding Centre that use more energy than all the lifts, restaurants and lodges Whistler and Blackcomb mountains combined but is used by only a small groups of specialized athletes
3 positive environmental projects at the Games

  1. the Olympic Line Street car (a City of Vancouver project)
  2. the Austria House (passivhaus) in Whistler (thanks to the Austrian team)
  3. free biking sharing in Richmond (donated by the Dutch)

Monday, February 1, 2010

Would you like some chemicals with your snow?

With the continuing warm temperatures in Vancouver, VANOC has had to resort to drastic measures to keep the snow at Cypress Bowl, the local snowboarding and ski venue.  They have said that they may use "snow hardening" chemicals to help prepare the snow for the games.  And this has local residents expressing concerns about those chemicals.

VANOC has ignored requests to identify which chemicals they will be using.  They have claimed that this measure was included in the provincial environmental assessment for the venue.  However, I was unable to find any mention of snow hardening or preserving chemicals in the assessment.

Generally the chemicals used to prepare ski and snowboard courses can include sodium chloride (salt), calcium chloride, urea, ammonium nitrate , and potassium nitrate.  Some of the chemicals used can be bio-accumulative.

A Swiss study found that water in streams fed by treated ski runs had much higher concentrations of salts than background levels measured in neighbouring streams. In fact, elevated levels were detected more than 15 years after treatment ended.  The chemicals also can contribute to higher levels of chlorides, nitrogen and phosphorous in the local water systems.

7YFQ2QFPM95C